Shot Distribution
Breakdown of shot types
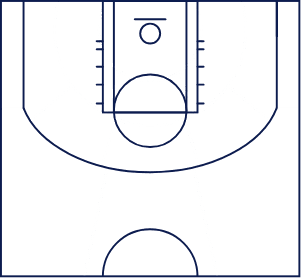
Shot Chart
Accuracy by shot region


Less Accurate
More Accurate
Shot Accuracy
Accuracy percentage by shot type
Points Contribution
Player scoring impact per season
Proud League S8 D1&2
3 games
Contribution
2.09%
of team scoring
Player PPG
1.3Team PPG
63.7Proud League S8 D1&2 Playoff
1 game
Contribution
0.00%
of team scoring
Player PPG
0.0Team PPG
49.0All Seasons
Average4 games
Contribution
1.18%
of team scoring
Player PPG
0.7Team PPG
56.3Match Statistics
All Stats
MATCH | DATE↓ | SCORE | PTS | 1PT | 2PT | 3PT | FT | REB | AST | TO |
|---|---|---|---|---|---|---|---|---|---|---|
MAV OLD | Jul 28 | 49-45 | 0 | 0-0 (0%) | 0-0 (0%) | 0-0 (0%) | 0-0 (0%) | 0 | 0 | 1 |
MAV BLA | May 26 | 67-53 | 0 | 0-0 (0%) | 0-2 (0%) | 0-0 (0%) | 0-0 (0%) | 1 | 1 | 0 |
MAV SUR | Apr 17 | 56-43 | 2 | 0-0 (0%) | 1-5 (20%) | 0-2 (0%) | 0-0 (0%) | 3 | 0 | 2 |
MAV OLD | Mar 24 | 68-50 | 2 | 0-0 (0%) | 1-4 (25%) | 0-0 (0%) | 0-0 (0%) | 0 | 0 | 1 |
Shot Distribution
Breakdown of shot types
Shot Chart
Accuracy by shot region
Less Accurate
More Accurate
Shot Accuracy
Accuracy percentage by shot type
Points Contribution
Player scoring impact per season
Proud League S8 D1&2
3 games
Contribution
2.09%
of team scoring
Player PPG
1.3Team PPG
63.7Proud League S8 D1&2 Playoff
1 game
Contribution
0.00%
of team scoring
Player PPG
0.0Team PPG
49.0All Seasons
Average4 games
Contribution
1.18%
of team scoring
Player PPG
0.7Team PPG
56.3Match Statistics
All Stats
MATCH | DATE↓ | SCORE | PTS | 1PT | 2PT | 3PT | FT | REB | AST | TO |
|---|---|---|---|---|---|---|---|---|---|---|
MAV OLD | Jul 28 | 49-45 | 0 | 0-0 (0%) | 0-0 (0%) | 0-0 (0%) | 0-0 (0%) | 0 | 0 | 1 |
MAV BLA | May 26 | 67-53 | 0 | 0-0 (0%) | 0-2 (0%) | 0-0 (0%) | 0-0 (0%) | 1 | 1 | 0 |
MAV SUR | Apr 17 | 56-43 | 2 | 0-0 (0%) | 1-5 (20%) | 0-2 (0%) | 0-0 (0%) | 3 | 0 | 2 |
MAV OLD | Mar 24 | 68-50 | 2 | 0-0 (0%) | 1-4 (25%) | 0-0 (0%) | 0-0 (0%) | 0 | 0 | 1 |
Powered by ScoreLab