Joe
11
PPG
13.7
RPG
4.8
APG
0.8
Joe
11
PPG
13.7
RPG
4.8
APG
0.8
Shot Distribution
Breakdown of shot types
Shot Chart
Accuracy by shot region








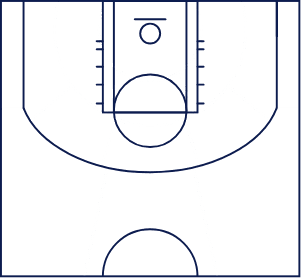
Less Accurate
More Accurate
Shot Accuracy
Accuracy percentage by shot type
Points Contribution
Player scoring impact per season
Proud League S8 D3
7 games
Contribution
31.67%
of team scoring
Player PPG
15.4Team PPG
48.7Proud League S8 D3 Playoff
2 games
Contribution
21.13%
of team scoring
Player PPG
7.5Team PPG
35.5All Seasons
Average9 games
Contribution
27.23%
of team scoring
Player PPG
11.5Team PPG
42.1Match Statistics
All Stats
MATCH | DATE↓ | SCORE | PTS | 1PT | 2PT | 3PT | FT | REB | AST | TO |
|---|---|---|---|---|---|---|---|---|---|---|
HAP EP | Aug 07 | 44-38 | 7 | 0-0 (0%) | 2-6 (33%) | 1-4 (25%) | 0-3 (0%) | 6 | 0 | 5 |
HAS EP | Jul 24 | 58-33 | 8 | 0-0 (0%) | 4-14 (29%) | 0-2 (0%) | 0-0 (0%) | 3 | 0 | 4 |
SHI EP | Jun 05 | 64-47 | 21 | 0-0 (0%) | 10-21 (48%) | 0-4 (0%) | 1-3 (33%) | 4 | 1 | 1 |
SKY EP | May 21 | 33-62 | 19 | 0-0 (0%) | 6-10 (60%) | 1-2 (50%) | 4-6 (67%) | 1 | 2 | 1 |
BLA EP | May 12 | 48-51 | 23 | 0-0 (0%) | 6-9 (67%) | 3-10 (30%) | 2-5 (40%) | 7 | 0 | 0 |
EP HAS | Mar 27 | 42-62 | 10 | 0-0 (0%) | 1-5 (20%) | 2-2 (100%) | 2-4 (50%) | 4 | 1 | 2 |
EP 佐敦 | Mar 04 | 57-31 | 9 | 0-0 (0%) | 3-7 (43%) | 1-2 (50%) | 0-0 (0%) | 8 | 2 | 0 |
EP HAP | Feb 24 | 43-45 | 15 | 0-0 (0%) | 4-8 (50%) | 1-3 (33%) | 4-4 (100%) | 5 | 0 | 2 |
籃影 EP | Jan 17 | 25-39 | 11 | 0-0 (0%) | 4-9 (44%) | 1-3 (33%) | 0-0 (0%) | 5 | 1 | 2 |
Shot Distribution
Breakdown of shot types
Shot Chart
Accuracy by shot region


Less Accurate
More Accurate
Shot Accuracy
Accuracy percentage by shot type
Points Contribution
Player scoring impact per season
Proud League S8 D3
7 games
Contribution
31.67%
of team scoring
Player PPG
15.4Team PPG
48.7Proud League S8 D3 Playoff
2 games
Contribution
21.13%
of team scoring
Player PPG
7.5Team PPG
35.5All Seasons
Average9 games
Contribution
27.23%
of team scoring
Player PPG
11.5Team PPG
42.1Match Statistics
All Stats
MATCH | DATE↓ | SCORE | PTS | 1PT | 2PT | 3PT | FT | REB | AST | TO |
|---|---|---|---|---|---|---|---|---|---|---|
HAP EP | Aug 07 | 44-38 | 7 | 0-0 (0%) | 2-6 (33%) | 1-4 (25%) | 0-3 (0%) | 6 | 0 | 5 |
HAS EP | Jul 24 | 58-33 | 8 | 0-0 (0%) | 4-14 (29%) | 0-2 (0%) | 0-0 (0%) | 3 | 0 | 4 |
SHI EP | Jun 05 | 64-47 | 21 | 0-0 (0%) | 10-21 (48%) | 0-4 (0%) | 1-3 (33%) | 4 | 1 | 1 |
SKY EP | May 21 | 33-62 | 19 | 0-0 (0%) | 6-10 (60%) | 1-2 (50%) | 4-6 (67%) | 1 | 2 | 1 |
BLA EP | May 12 | 48-51 | 23 | 0-0 (0%) | 6-9 (67%) | 3-10 (30%) | 2-5 (40%) | 7 | 0 | 0 |
EP HAS | Mar 27 | 42-62 | 10 | 0-0 (0%) | 1-5 (20%) | 2-2 (100%) | 2-4 (50%) | 4 | 1 | 2 |
EP 佐敦 | Mar 04 | 57-31 | 9 | 0-0 (0%) | 3-7 (43%) | 1-2 (50%) | 0-0 (0%) | 8 | 2 | 0 |
EP HAP | Feb 24 | 43-45 | 15 | 0-0 (0%) | 4-8 (50%) | 1-3 (33%) | 4-4 (100%) | 5 | 0 | 2 |
籃影 EP | Jan 17 | 25-39 | 11 | 0-0 (0%) | 4-9 (44%) | 1-3 (33%) | 0-0 (0%) | 5 | 1 | 2 |
Are you the organiser? Manage this player here.
