Ryan Chew
6
PPG
1.4
RPG
4.0
APG
0.4
Ryan Chew
6
PPG
1.4
RPG
4.0
APG
0.4
Shot Distribution
Breakdown of shot types
Shot Chart
Accuracy by shot region


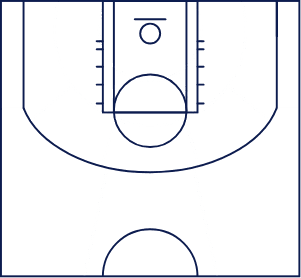
Less Accurate
More Accurate
Shot Accuracy
Accuracy percentage by shot type
Points Contribution
Player scoring impact per season
DSAYBL U10 Division 2
5 games
Contribution
24.14%
of team scoring
Player PPG
1.4Team PPG
5.8Match Statistics
All Stats
MATCH | DATE↓ | SCORE | PTS | 1PT | 2PT | 3PT | FT | REB | AST | TO |
|---|---|---|---|---|---|---|---|---|---|---|
U10 U10 | Mar 26 | 31-4 | 0 | 0-0 (0%) | 0-14 (0%) | 0-0 (0%) | 0-3 (0%) | 10 | 1 | 5 |
U10 U10 | Mar 19 | 30-8 | 2 | 0-0 (0%) | 1-10 (10%) | 0-0 (0%) | 0-2 (0%) | 5 | 0 | 6 |
U10 U10 | Mar 12 | 14-31 | 4 | 0-0 (0%) | 2-13 (15%) | 0-0 (0%) | 0-0 (0%) | 3 | 1 | 4 |
U10 U10 | Mar 05 | 34-2 | 0 | 0-0 (0%) | 0-2 (0%) | 0-0 (0%) | 0-0 (0%) | 1 | 0 | 3 |
U10 U10 | Feb 26 | 24-1 | 1 | 0-0 (0%) | 0-3 (0%) | 0-0 (0%) | 1-8 (13%) | 1 | 0 | 3 |
Shot Distribution
Breakdown of shot types
Shot Chart
Accuracy by shot region
Less Accurate
More Accurate
Shot Accuracy
Accuracy percentage by shot type
Points Contribution
Player scoring impact per season
DSAYBL U10 Division 2
5 games
Contribution
24.14%
of team scoring
Player PPG
1.4Team PPG
5.8Match Statistics
All Stats
MATCH | DATE↓ | SCORE | PTS | 1PT | 2PT | 3PT | FT | REB | AST | TO |
|---|---|---|---|---|---|---|---|---|---|---|
U10 U10 | Mar 26 | 31-4 | 0 | 0-0 (0%) | 0-14 (0%) | 0-0 (0%) | 0-3 (0%) | 10 | 1 | 5 |
U10 U10 | Mar 19 | 30-8 | 2 | 0-0 (0%) | 1-10 (10%) | 0-0 (0%) | 0-2 (0%) | 5 | 0 | 6 |
U10 U10 | Mar 12 | 14-31 | 4 | 0-0 (0%) | 2-13 (15%) | 0-0 (0%) | 0-0 (0%) | 3 | 1 | 4 |
U10 U10 | Mar 05 | 34-2 | 0 | 0-0 (0%) | 0-2 (0%) | 0-0 (0%) | 0-0 (0%) | 1 | 0 | 3 |
U10 U10 | Feb 26 | 24-1 | 1 | 0-0 (0%) | 0-3 (0%) | 0-0 (0%) | 1-8 (13%) | 1 | 0 | 3 |
Are you the organiser? Manage this player here.