Johnny Huang
0
PPG
7.0
RPG
2.2
APG
1.3
Johnny Huang
0
PPG
7.0
RPG
2.2
APG
1.3
Shot Distribution
Breakdown of shot types
Shot Chart
Accuracy by shot region










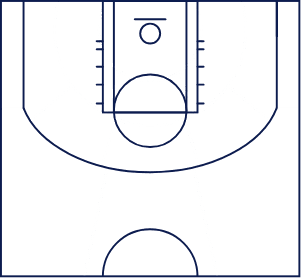
Less Accurate
More Accurate
Shot Accuracy
Accuracy percentage by shot type
Points Contribution
Player scoring impact per season
OCABL - Season 4
8 games
Contribution
18.92%
of team scoring
Player PPG
7.0Team PPG
37.0OCABL - Season 4 - Playoff
2 games
Contribution
21.54%
of team scoring
Player PPG
7.0Team PPG
32.5All Seasons
Average10 games
Contribution
20.14%
of team scoring
Player PPG
7.0Team PPG
34.8Match Statistics
All Stats
MATCH | DATE↓ | SCORE | PTS | 1PT | 2PT | 3PT | FT | REB | AST | TO |
|---|---|---|---|---|---|---|---|---|---|---|
USC MIC | Jan 28 | 34-47 | 8 | 0-0 (0%) | 1-2 (50%) | 2-6 (33%) | 0-0 (0%) | 2 | 1 | 1 |
USC CAL | Nov 12 | 31-34 | 6 | 0-0 (0%) | 1-3 (33%) | 1-3 (33%) | 1-2 (50%) | 1 | 2 | 0 |
WAS USC | Nov 05 | 30-36 | 2 | 0-0 (0%) | 1-4 (25%) | 0-2 (0%) | 0-0 (0%) | 4 | 0 | 0 |
USC UCL | Oct 22 | 24-46 | 3 | 0-0 (0%) | 0-2 (0%) | 1-4 (25%) | 0-0 (0%) | 0 | 0 | 0 |
USC CAL | Sep 24 | 32-45 | 3 | 0-0 (0%) | 0-2 (0%) | 1-5 (20%) | 0-0 (0%) | 2 | 2 | 1 |
UNS USC | Aug 21 | 47-40 | 18 | 0-0 (0%) | 4-8 (50%) | 3-7 (43%) | 1-1 (100%) | 4 | 2 | 2 |
UCL USC | Jul 23 | 38-35 | 12 | 0-0 (0%) | 3-4 (75%) | 2-3 (67%) | 0-0 (0%) | 4 | 2 | 2 |
UCS USC | Jul 10 | 39-28 | 7 | 0-0 (0%) | 2-5 (40%) | 1-2 (50%) | 0-1 (0%) | 2 | 1 | 7 |
USC MIC | Jun 04 | 55-22 | 11 | 0-0 (0%) | 3-6 (50%) | 1-3 (33%) | 2-2 (100%) | 1 | 3 | 0 |
USC UCL | May 22 | 46-53 | 0 | 0-0 (0%) | 0-5 (0%) | 0-1 (0%) | 0-0 (0%) | 2 | 0 | 1 |
Shot Distribution
Breakdown of shot types
Shot Chart
Accuracy by shot region


Less Accurate
More Accurate
Shot Accuracy
Accuracy percentage by shot type
Points Contribution
Player scoring impact per season
OCABL - Season 4
8 games
Contribution
18.92%
of team scoring
Player PPG
7.0Team PPG
37.0OCABL - Season 4 - Playoff
2 games
Contribution
21.54%
of team scoring
Player PPG
7.0Team PPG
32.5All Seasons
Average10 games
Contribution
20.14%
of team scoring
Player PPG
7.0Team PPG
34.8Match Statistics
All Stats
MATCH | DATE↓ | SCORE | PTS | 1PT | 2PT | 3PT | FT | REB | AST | TO |
|---|---|---|---|---|---|---|---|---|---|---|
USC MIC | Jan 28 | 34-47 | 8 | 0-0 (0%) | 1-2 (50%) | 2-6 (33%) | 0-0 (0%) | 2 | 1 | 1 |
USC CAL | Nov 12 | 31-34 | 6 | 0-0 (0%) | 1-3 (33%) | 1-3 (33%) | 1-2 (50%) | 1 | 2 | 0 |
WAS USC | Nov 05 | 30-36 | 2 | 0-0 (0%) | 1-4 (25%) | 0-2 (0%) | 0-0 (0%) | 4 | 0 | 0 |
USC UCL | Oct 22 | 24-46 | 3 | 0-0 (0%) | 0-2 (0%) | 1-4 (25%) | 0-0 (0%) | 0 | 0 | 0 |
USC CAL | Sep 24 | 32-45 | 3 | 0-0 (0%) | 0-2 (0%) | 1-5 (20%) | 0-0 (0%) | 2 | 2 | 1 |
UNS USC | Aug 21 | 47-40 | 18 | 0-0 (0%) | 4-8 (50%) | 3-7 (43%) | 1-1 (100%) | 4 | 2 | 2 |
UCL USC | Jul 23 | 38-35 | 12 | 0-0 (0%) | 3-4 (75%) | 2-3 (67%) | 0-0 (0%) | 4 | 2 | 2 |
UCS USC | Jul 10 | 39-28 | 7 | 0-0 (0%) | 2-5 (40%) | 1-2 (50%) | 0-1 (0%) | 2 | 1 | 7 |
USC MIC | Jun 04 | 55-22 | 11 | 0-0 (0%) | 3-6 (50%) | 1-3 (33%) | 2-2 (100%) | 1 | 3 | 0 |
USC UCL | May 22 | 46-53 | 0 | 0-0 (0%) | 0-5 (0%) | 0-1 (0%) | 0-0 (0%) | 2 | 0 | 1 |
Are you the organiser? Manage this player here.
