U10 GRIFFINS (Season 2)
0
W
6
L
1
D
PPG
12.1
RPG
7.6
APG
0.1

U10 GRIFFINS (Season 2)
0
W
6
L
1
D
PPG
12.1
RPG
7.6
APG
0.1
Shot Distribution
Breakdown of shot types
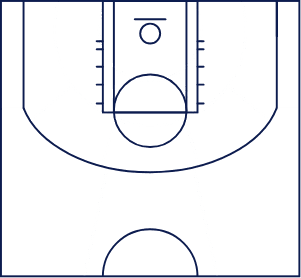
Shot Chart
Accuracy by shot region


Less Accurate
More Accurate
Shot Accuracy
Accuracy percentage by shot type
Shot Distribution
Breakdown of shot types
Shot Chart
Accuracy by shot region


Less Accurate
More Accurate
Shot Accuracy
Accuracy percentage by shot type
Match Results
All Stats
Match | Date↓ | Score | PTS | 1PT | 2PT | 3PT | FT | REB | AST | TO |
|---|---|---|---|---|---|---|---|---|---|---|
  | May 24 | 23-36 | 23 | 0-0 (0%) | 9-46 (20%) | 0-0 (0%) | 5-16 (31%) | 4 | 0 | 2 |
  | May 11 | 5-14 | 5 | 0-0 (0%) | 0-19 (0%) | 0-0 (0%) | 5-14 (36%) | 9 | 0 | 10 |
  | May 03 | 36-8 | 8 | 0-0 (0%) | 4-31 (13%) | 0-0 (0%) | 0-0 (0%) | 19 | 1 | 1 |
  | Apr 12 | 33-9 | 9 | 0-0 (0%) | 2-20 (10%) | 0-0 (0%) | 5-15 (33%) | 10 | 0 | 5 |
  | Mar 30 | 23-12 | 12 | 0-0 (0%) | 5-28 (18%) | 0-0 (0%) | 2-8 (25%) | 3 | 0 | 0 |
  | Mar 22 | 24-24 | 24 | 0-0 (0%) | 11-22 (50%) | 0-0 (0%) | 2-5 (40%) | 0 | 0 | 0 |
  | Mar 09 | 4-21 | 4 | 0-0 (0%) | 2-14 (14%) | 0-0 (0%) | 0-0 (0%) | 8 | 0 | 2 |
Are you the organiser? Manage this team here.
